Scroll through the platform: what each indicator does, what it shows and how to read it.
The indicators
Scroll through the platform: what each indicator does, what it shows and how to read it.
Indicator 1 of 13Regimes
Macro Regime Quadrant
What it does. Combines about 120 macro series into one reading of the economy across four regimes: Balanced Growth, Overheating, Economic Stress and Stagflation.
What it shows. How closely today's economy resembles each regime — not a single label but a probability for each — and the direction it is moving in.
How to read it
1The chart. The growth/inflation map: each quadrant is a regime, the dot is today's position and the trail shows where it came from.
2The explanation. What the model measures and how each regime has historically treated equities, bonds, real assets and cash.
3The current state. The dominant regime right now and its probability.
Indicator 2 of 13Regimes
Business Cycle
What it does. Tracks the OECD Composite Leading Indicator, built to turn before the economy does.
What it shows. Which phase of the business cycle we are in — expansion, slowdown, contraction or recovery — and whether it is gaining or losing momentum.
How to read it
1The chart. The leading indicator against its long-run trend (100), with the four phases shaded behind it.
2The explanation. Why crossing 100 while rising means something different from crossing it while falling, and what each phase has historically favoured.
3The current state. The latest reading and the phase it places the economy in.
Indicator 3 of 13Market Risk
Crash Probability
What it does. Measures the price of protection against a large S&P 500 drop and how fast that protection is getting more expensive.
What it shows. How braced the options market is for a large move — a risk gauge, not a timing tool. Here, the last three months of data.
How to read it
1The chart. The score over the last three months, between the low-risk and the high-risk zone.
2The explanation. What the score is built from and what its three readings — high, neutral, low — have historically meant.
3The current state. Now: today's score on the gauge, split into level and momentum.
The full range
The full MacroBeats set
Thirteen indicators across three blocks — each with its current reading, methodology and guide.
You've seen 3 of 13+10 more inside the platform
Macroeconomic Regimes
✓Macro Regime Quadrant
✓Business Cycle
Manufacturing Cycle
Financial Conditions
Monetary Policy Stance
Credit Impulse
Inflation
Financial Stability Index
Yield Curve
Market Risk
✓Crash Probability
Evaluation Risk
Geopolitical Risk
Diversification Risk
Capital Rotation Risk
How it fits together
From signals to portfolio decisions
ƒ
Each EconoBeats indicator is powered by a dedicated data science model built to transform complex economic and market data into a clear, actionable signal. Each signal is designed to add value independently by answering a specific investment question.
Σ
Combined, the indicators provide a broader view of the forces driving markets — helping investors evaluate opportunities, control risk and make more consistent portfolio decisions.
➤
Actionable Layers connect multiple indicators into practical decision frameworks, helping investors interpret changing market conditions and translate data into clearer portfolio actions.
Reports · Company valuation
From a universe of companies to your portfolio
Every company report starts wide and ends precise: a quantitative screen of a large set of companies, one company analysed in depth, and a clear way to size it in a portfolio.
01Screen the universeA wide universe of listed companies, filtered on quality, value and the cycle.
02Quant valuationScenario-based intrinsic value, cross-checked with multiples.
03Pick one companyThe strongest candidate goes to a full, bottom-up analysis.
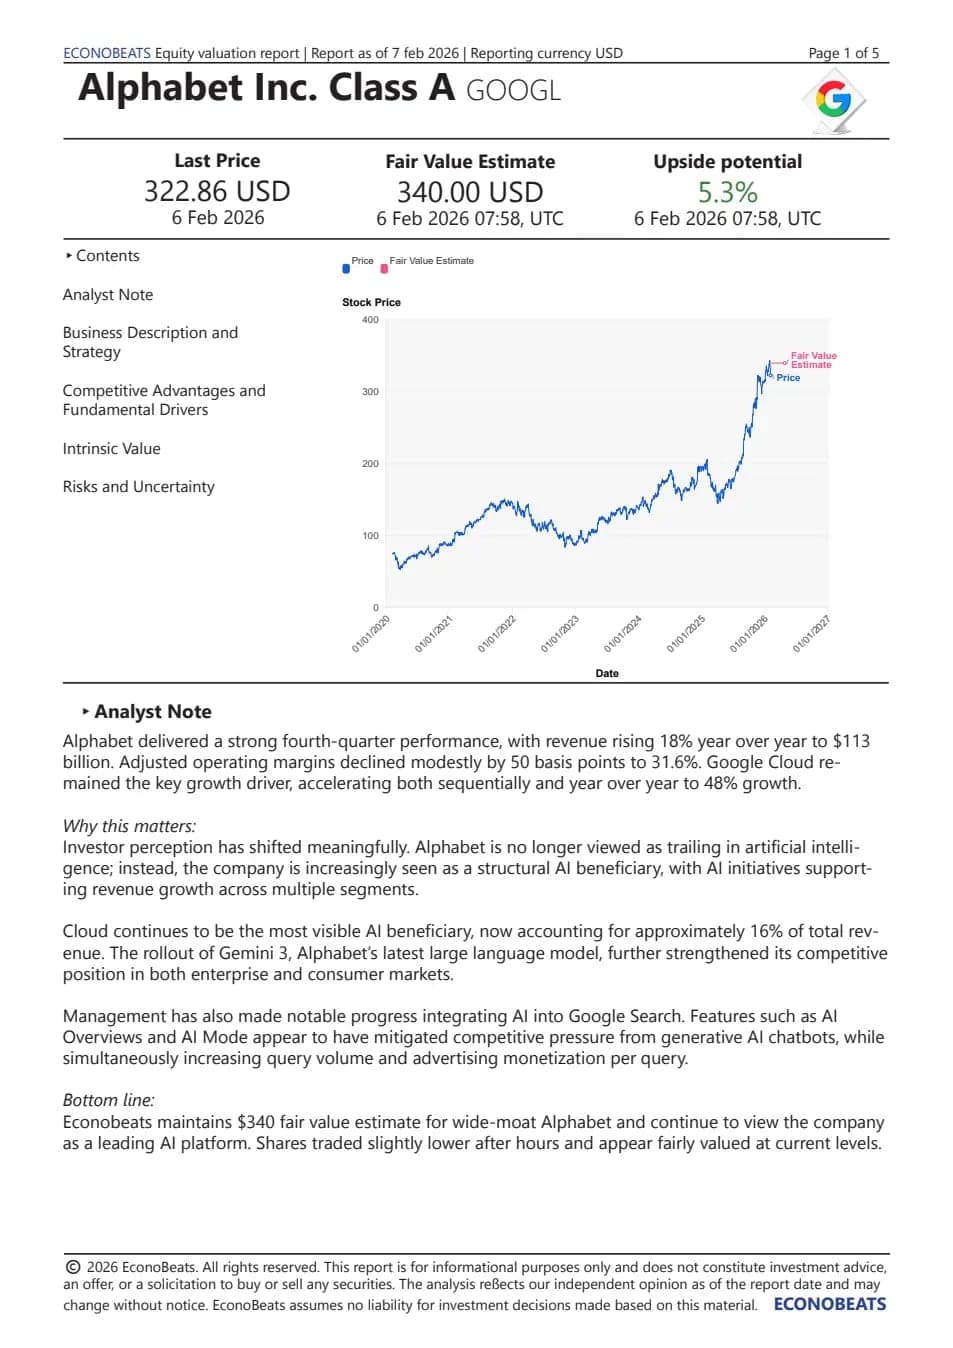
04 The result: valuation report
Price vs fair valueTopics
05A trade idea for youThesis, entry zone, risk limits and catalysts, for you to judge.
06Your portfolio sliceYou decide whether it earns a place in your portfolio, and how much.
That's the tour.
Inside the platform every indicator is live — with its full history, what it shows and how to read it.